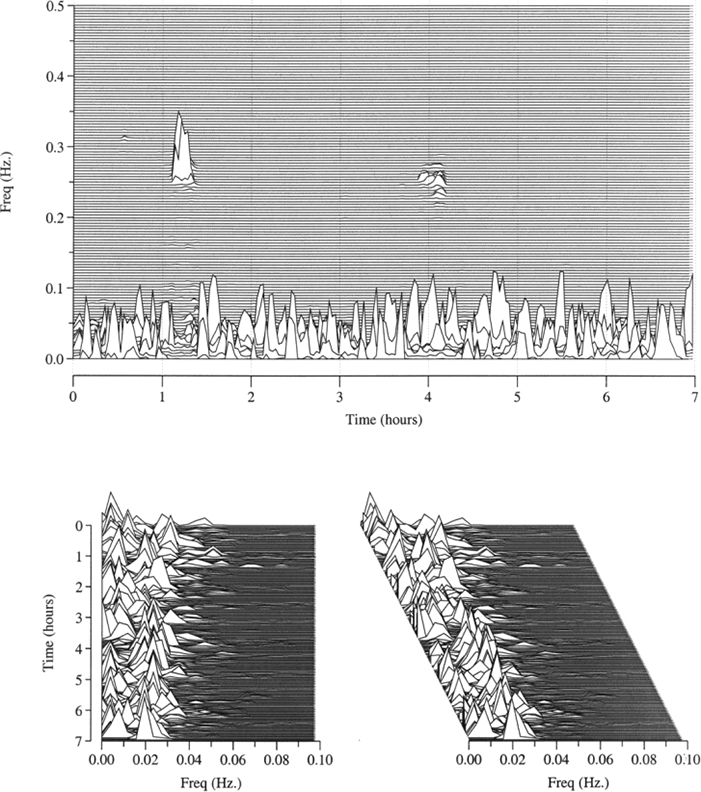
Figure 2.

Spectrographic obstructive sleep apnea. A 62-year-old man with an AHI of 49 events per hour of sleep. Broad spectral band e-LFC suggests oscillations driven by anatomical abnormality. Top: The all night sleep spectrogram. The upper panel shows nearly complete loss of high frequency coupling. Lower left and right: 90° and 60° rotated views of the low-frequency spectral zone from the same subject showing the spectral dispersion within the low-frequency cardiopulmonary coupling spectrum. This view demonstrates the characteristics of virtually pure elevated broad spectral band LFC. Conventional scoring of the respiratory events in this instance is usually “obstructive”, but may also be “mixed.”
