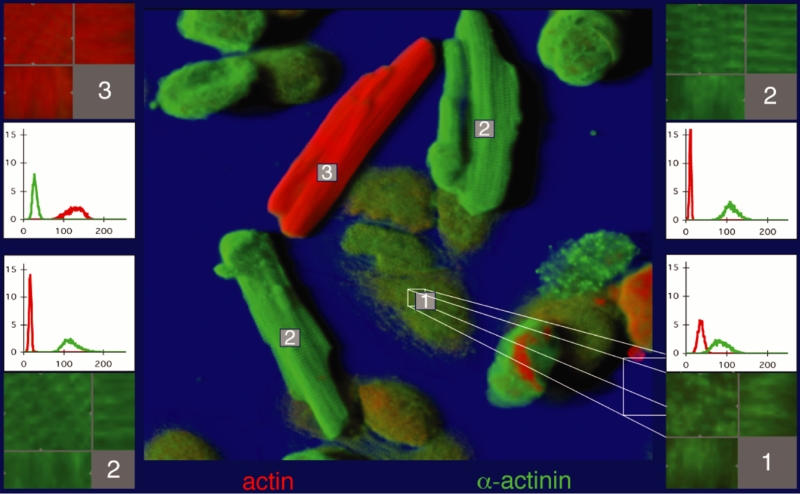
Figure 2).
Cardiomyocytes in culture at day 10 plus 3 h coculture. Shadow projection: Green represents alpha-actinin and red represents actin. (Cell 1) Spreading cells contain both actin and alpha-actinin, but more of the latter (histogram). (Cell 2) ‘Second-floor’ cells show only a small amount of actin but are strongly positive for alpha-actinin. (Cell 3) Cell was added at day 10 and shows plenty of actin; these cells served as a control for all measurements. The corresponding coloured boxes show the volume of interest (VOI) in section mode, with the corresponding xz-plane (below) and the yz-plane (right). The histograms (ordinate: brightness of fluorescence; abscissa: number of pixels) show the quantitative evaluation (red represents actin and green represents alpha-actinin)

