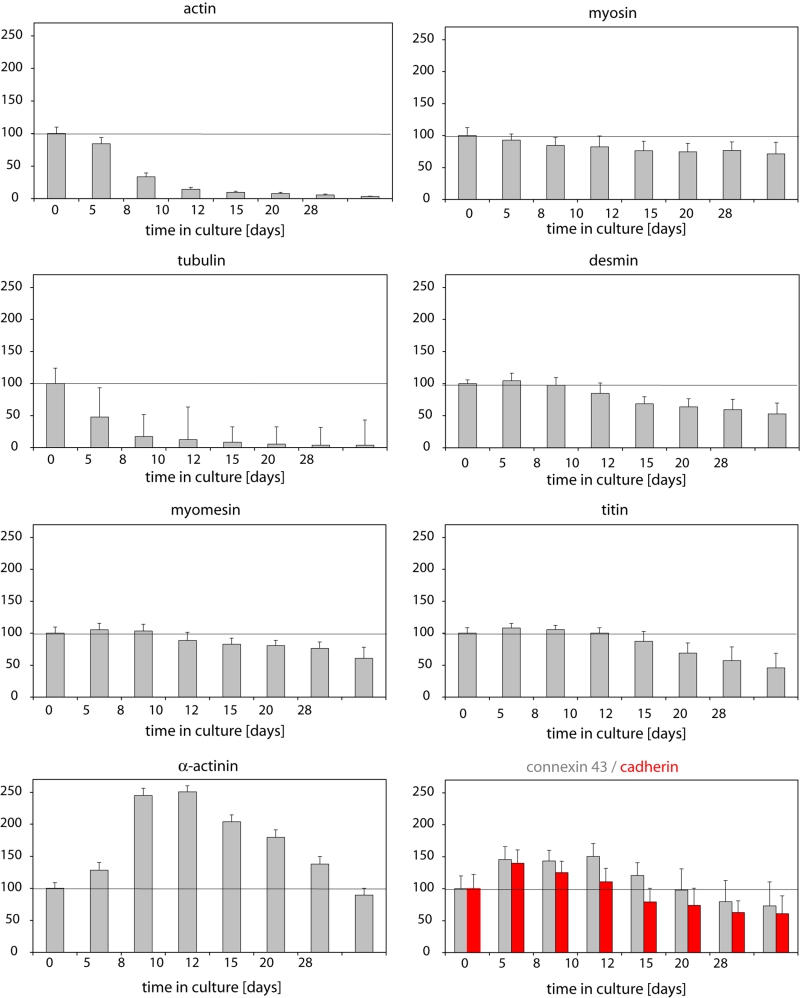
Figure 3).
Quantitative evaluation of the brightness of fluorescence at varying times (in per cent of control [control defined as 100%]). Measurements were carried out in ‘second-floor’ cells and cocultured cells served as controls (see Figure 2). Note that actin and tubulin show a steep decrease, while all other proteins with the exception of alpha-actinin show a late decline. The significant increase in alpha-actinin fluorescence intensity may not reflect the true amount of the protein but the fact that more alpha-actinin epitopes are accessible for the antibody, because the actin rapidly disappears (bare Z-line)

