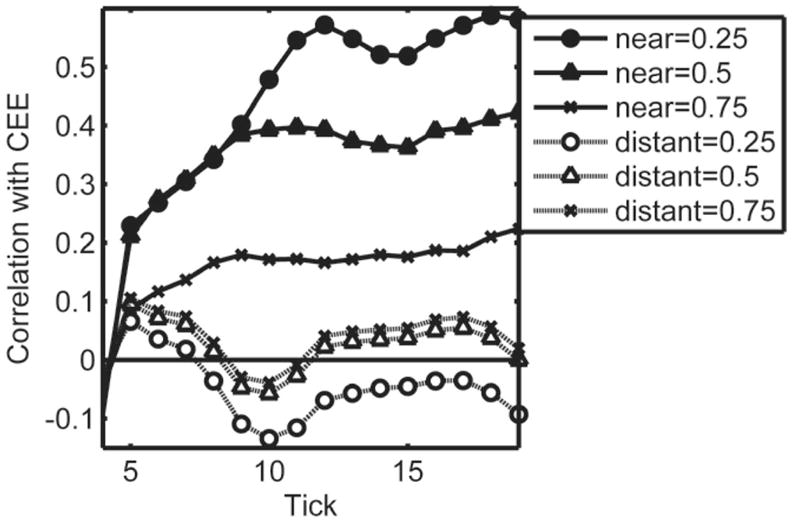
Figure 3.

Correlations at each tick between cross-entropy error (CEE) and number of near neighbors (solid lines, black symbols) and number of distant neighbors (dotted lines, white symbols) across all concepts in the corpus. Correlations greater than ± .09 are statistically reliable (p < .05). The correlations were computed for three levels of threshold defining near and distant neighbors. In the legend, “near = 0.25” indicates that near neighbors were defined as having minimum cosine 0.25 and “distant = 0.25” indicates that distant neighbors were defined as having maximum cosine 0.25 (for distant neighbors the minimum cosine was always 0).
