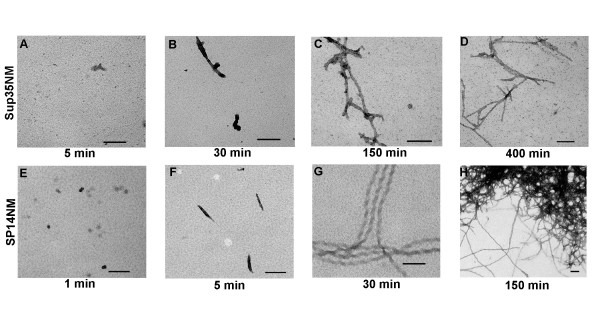
Figure 3.
Unseeded SP14NM fiber formation is faster than Sup35NM fiber formation as monitored by TEM. The scale bar represents 100 nm. Sup35NM (5 μM) after (A) 5 min, (B) 30 min, (C) 150 min, (D) 400 min and SP14NM (5 μM) after (E) 1 min, (F) 5 min, (G) 30 min, (H) 150 min. Representative images are shown for each time point with the exception of (H) because the fibers were clumped, leaving the EM grid largely empty. See Figure 7A and 7E for comparisons to 24 hour time point.

