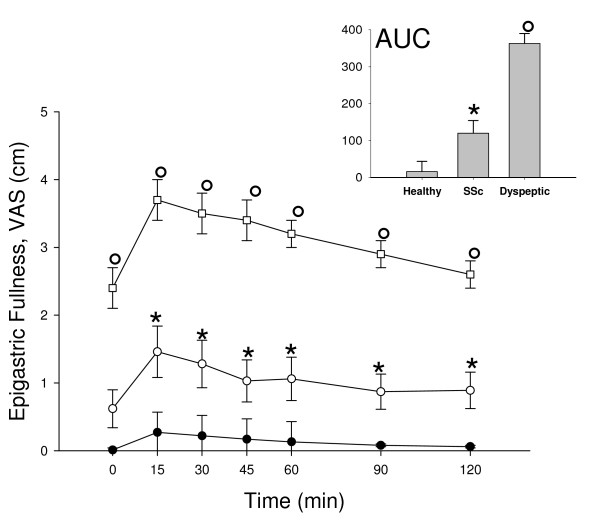
Figure 1.
Time-course of Visual Analogue Scale (VAS) for epigastric fullness in the fasting state (Time 0) and at regular intervals postprandially during the motility tests in SSc patients (white circles), healthy controls (black circles) and in dyspeptic controls (white squares) at each time point. Vertical lines indicate SE values. In the inset: Area Under Curve *P < 0.01 vs healthy controls; °P < 0.01 vs both SSc patients and healthy controls (ANOVA followed by Fisher's LSD test).

