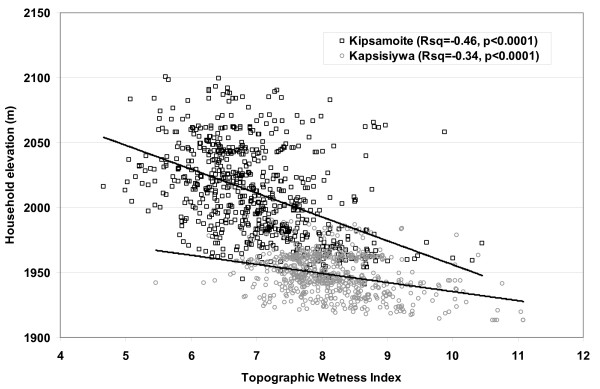
Figure 5.
Relationship between elevation and predicted wetness. Plot of predicted wetness (X-axis) at the location of households in Kipsamoite (black squares) and Kapsisiywa (gray circles) against household elevation (Y-axis). The overall r = -0.66 compared to -0.46 for Kipsamoite and -0.34 for Kapsisiywa.

