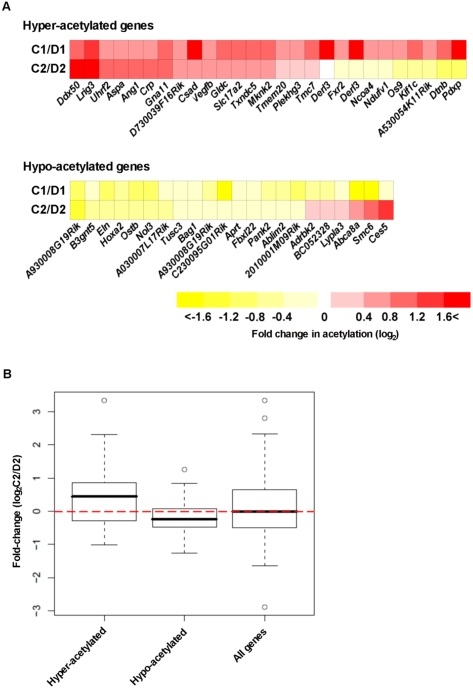
Figure 3. Conservation of H3K9Ac variation in other mouse clones.
Acetylation-state changes of each promoter site in the cloned mice are indicated by color, and as a multiple of corresponding donor mice (A). No-change is represented as white, increased acetylation is depicted as intensifying red color, and decreased acetylation is depicted as intensifying yellow color. The value of each change is the average of technical replicates (n = 2). Details of the target genes are reported in Table 1 and Table 2. (B) For each gene, the actual experimental values for the C2/D2 pair is graphically aligned in categories of hyper- or hypo-acetylation containing 26 and 22 genes, respectively, which is a reflection of gene-state determined in the C1/D1 mouse pair. Medians for each data set are indicated by black center lines, upper quartiles are indicated by upper edges of the box, and lower quartiles are indicated by lower edges of the box. Maximum and minimum values are marked as end of lines extending from the boxes. Values which are more than 1.5 times the inter-quartile range from the upper or lower quartile are represented as white circles and are considered outliers and not used in the calculations. The red dotted horizontal line indicates the position of median of all genes (hyper- and hypo-acetylated genes, total 48 genes).

