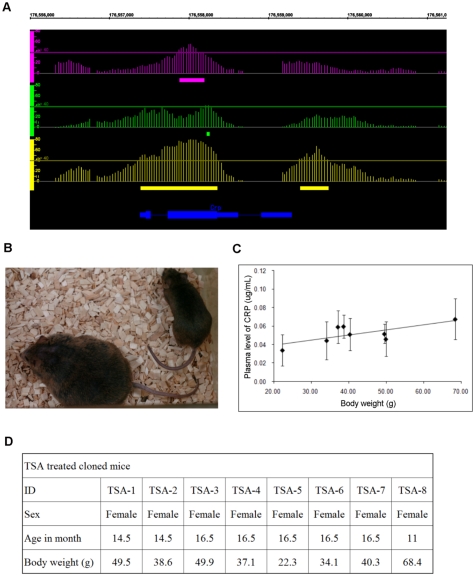
Figure 4. Crp levels in the blood of adult TSA-treated cloned mice of various weights.
(A) Result of ChIP on chip analysis at the region of the Crp gene. Horizontal axis represents alignment of Chr1 and the vertical axes represent P-value of tiling array intensity data. The scale of the genome viewer is given as coordinate of Chr.1 (bp). Upper tier (magenta) represents direct comparison of C1 ChIP sample vs. D1 ChIP sample, middle tier (green) represents D1 ChIP sample vs. WCE, and lower tier (yarrow) represents C1 ChIP sample vs. WCE. Each vertical line standing on the each tire represents positions of array probes and its −10logP value. Horizontal lines in each tier represent P = 10−4 and filled bars being bottom of each tier represent regions which are P<10−4 or less, respectively. Blue line represents the exon structure of the Crp gene. (B) Photograph of TSA-treated mice used for Crp plasma protein level measurements by ELISA. Right mouse is the leanest mouse (TSA-5) and left mouse is the most obese mouse (TSA-8). (C) Crp protein concentration in TSA-treated mouse clone serum measured by ELISA. The vertical axis represents the concentration of Crp protein in serum and the horizontal axis represents body weight. The concentration is shown as the average of four technical replicates (n = 4). Pearson correlation coefficient for the test is 0.72. (D) General information of TSA-treated mice. The information shows ID for the mice and corresponding sex, age (month), and body weight.

