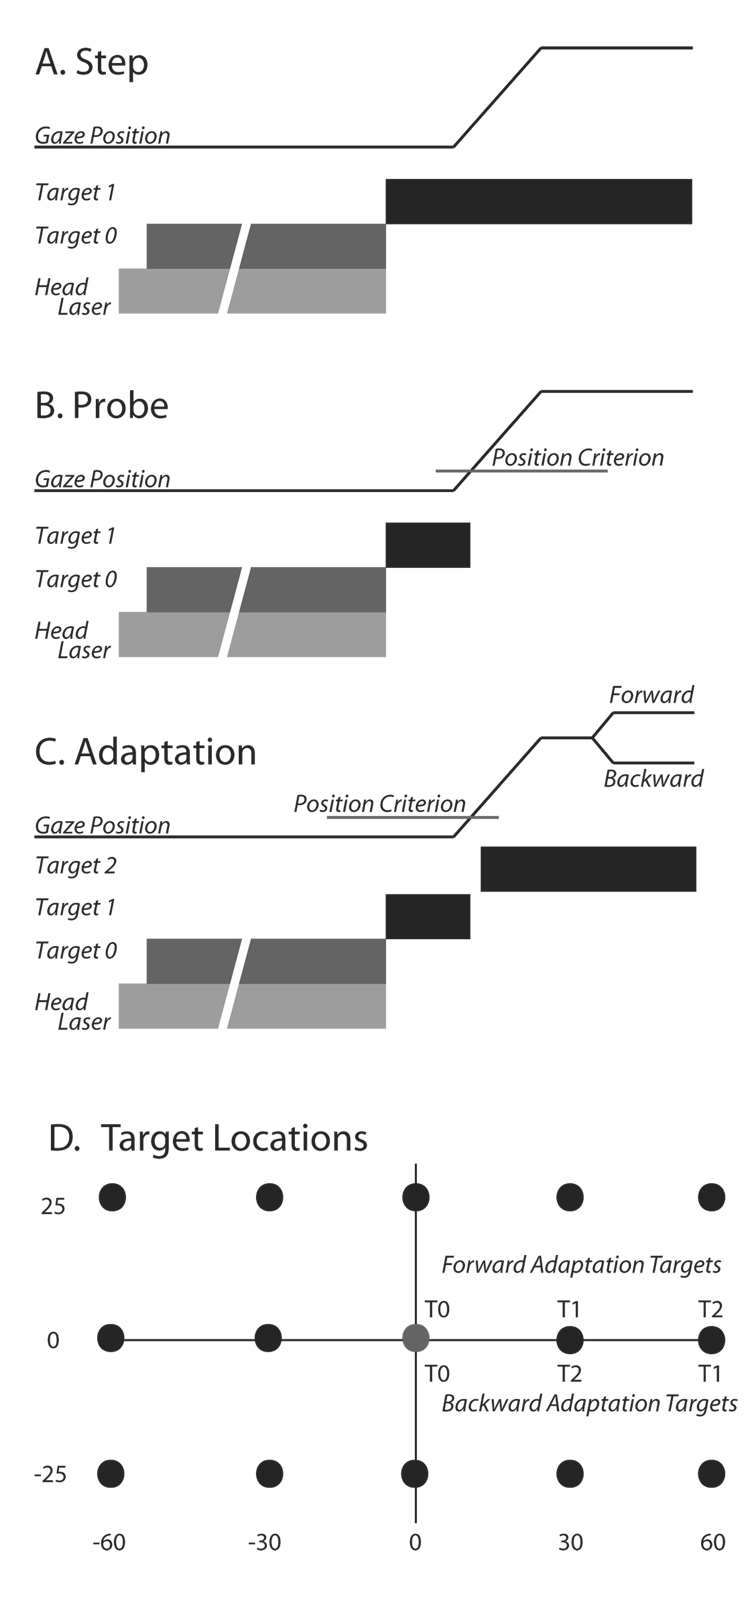
Figure 1.
A–C: Schematic diagrams of trial types used. In each panel, gaze position is represented by a thin black line and plotted as a function of time. Below this trace, targets are represented by thick bars indicating when within the trial each target was illuminated and extinguished. In all case, trials began with the illumination of a head-mounted laser (light gray bar) followed by presentation of T0. If behavioral contingencies were satisfied, the head-mounted laser and T0 target were extinguished and a second target (T1) was simultaneously illuminated at one of the spatial locations shown in panel D (black circles). A: The T1 target remained illuminated for the duration of the “target step” trials. B: During the “probe” trials, the T1 target was extinguished when the line of sight moved beyond a computer defined window (“position criterion”) surrounding T0. C: “Adaptation” trials were similar to probe trials until 20ms after the position criterion was satisfied, at which time T1 was turned off and a target at location T2 was illuminated. D: target locations used during adaptation and probe trials.

