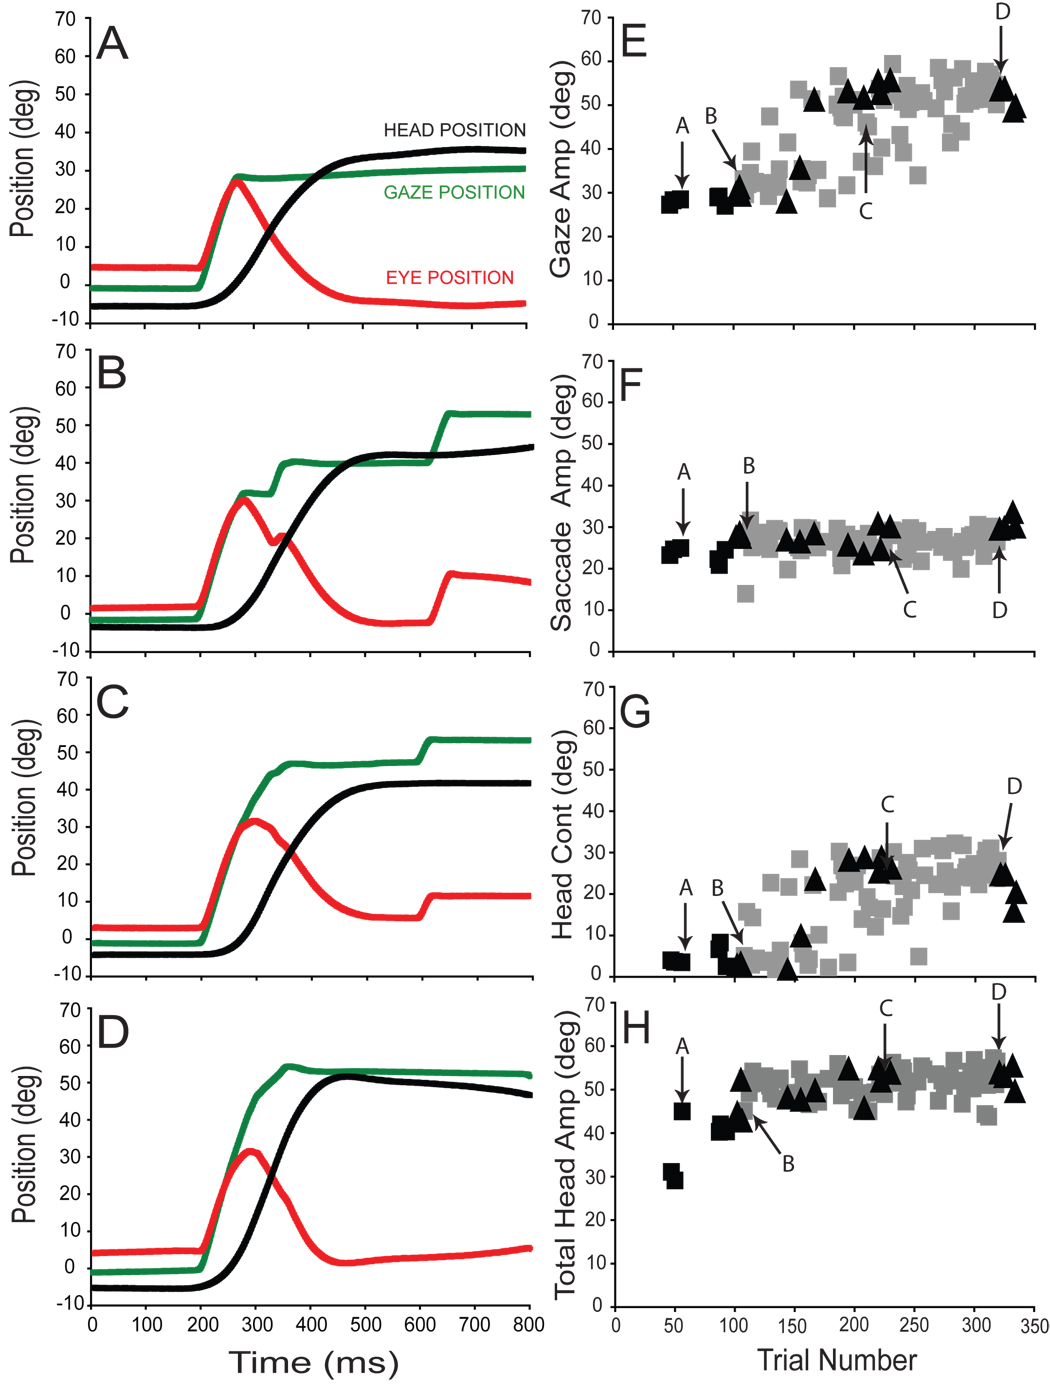
Figure 2.
Forward adaptation session (A7) with the eyes and head aligned. Panels A–D plot gaze (green), eye (red) and head (black) positions observed at specific times during the adaptation. Primary gaze (E), saccade (F), head contribution (G) and total head (H) movement amplitudes are plotted as functions of trial number. Pre-adaptation probe trials (black squares), probe trials during the adaptation phase (black triangles), and adaptation trials (grey squares) are superimposed for direct comparison. Labeled arrows indicate trials presented in panels A–D.

