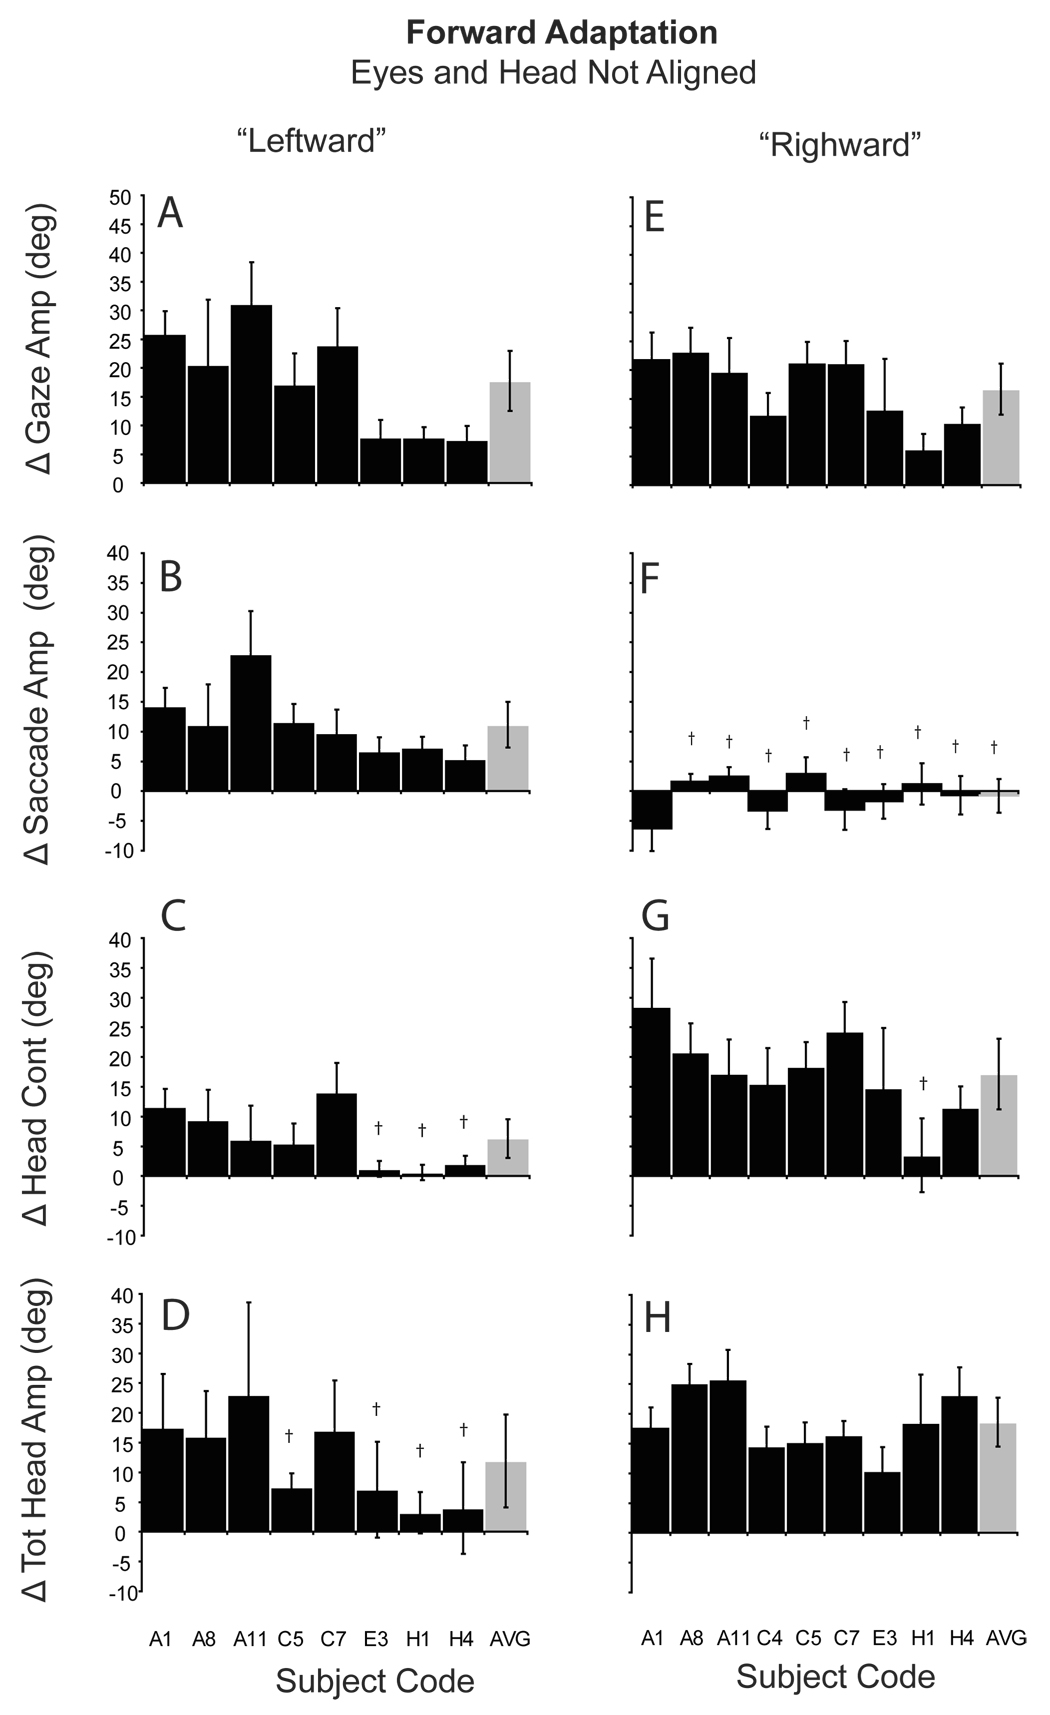
Figure 6.
Amplitude changes during forward adaptation when the eyes and head were not aligned. Histograms show the mean (±SD) difference between the last 5 adaptation trials and the last 5 pre-adaptation probe trials for gaze (A, E), saccade (B, F), head contribution (C, G), and total head amplitude (D, H). A–D: eyes initially deviated to the left; E–F: eyes initially deviated to the right. Gray bars indicate the group means (±SD). Subject/session codes indicated along the abscissa. † indicates non-significant change in amplitude (p>0.05; two-tailed t-test).

