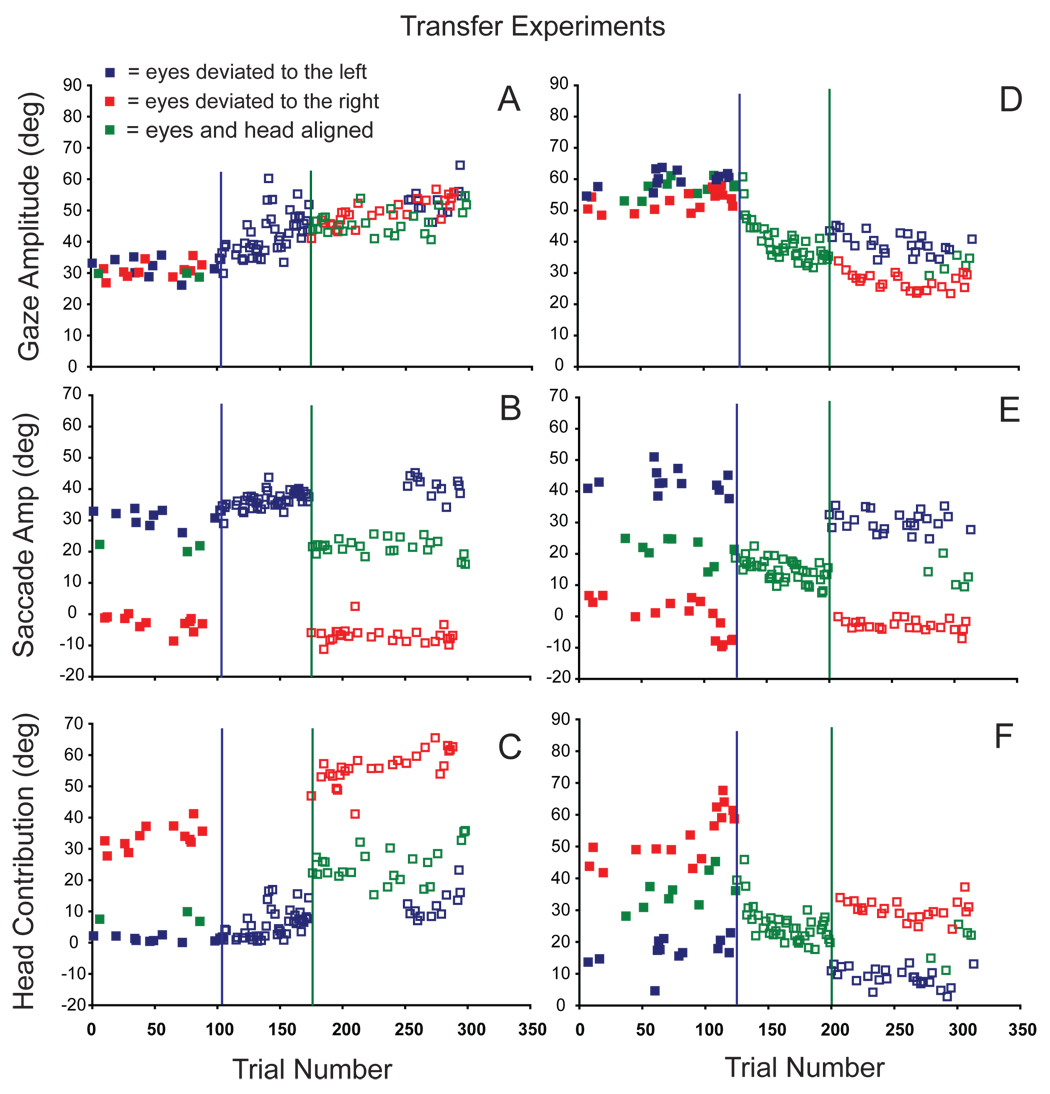
Figure 8.
During forward (A–C; experiment C7) and backward (D–F; experiment H3) adaptation, changes in gaze (A, D), eye (B, E) and head contribution (C, F) amplitudes are plotted as functions of trial number. Filled symbols illustrated movement amplitudes directed to T1 target locations during pre-adaptation trials when the eyes began either aligned with the head (green), or deviated in the orbits to the right (red), or left (blue). After ~100 trials adaptation began (blue vertical lines); adaptation trials were initiated with the eyes in one particular position (deviated to the left: A–C; aligned with the head: D–F). After ~75 adaptation trials (unfilled symbols) under these conditions, adaptation continued with the eyes in new (non-adapted) initial positions (green vertical lines). After an additional 100 adaptation trials initiated from these new eye positions, the original initial eye position was re-introduced.

