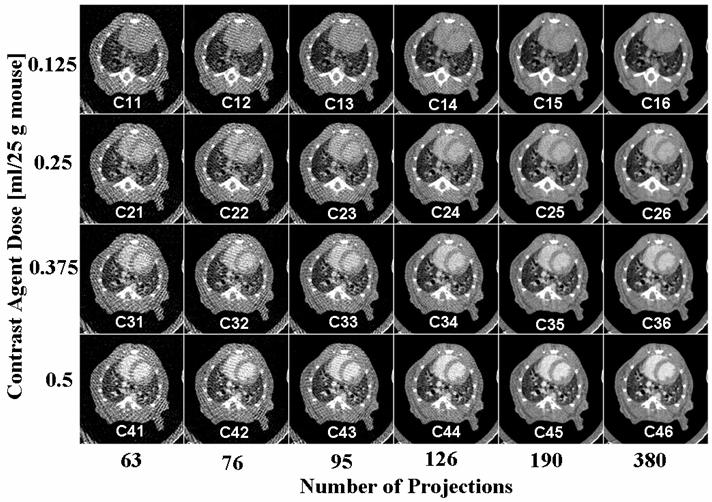
Fig.1.

An example of corresponding axial micro-CT slices in 24 datasets for 4 different levels of contrast agent and 6 levels of reconstruction projections. The sets are labeled for further reference. Note that the best image corresponds to maximum contrast dose and maximum number of projections (i.e. C46).
