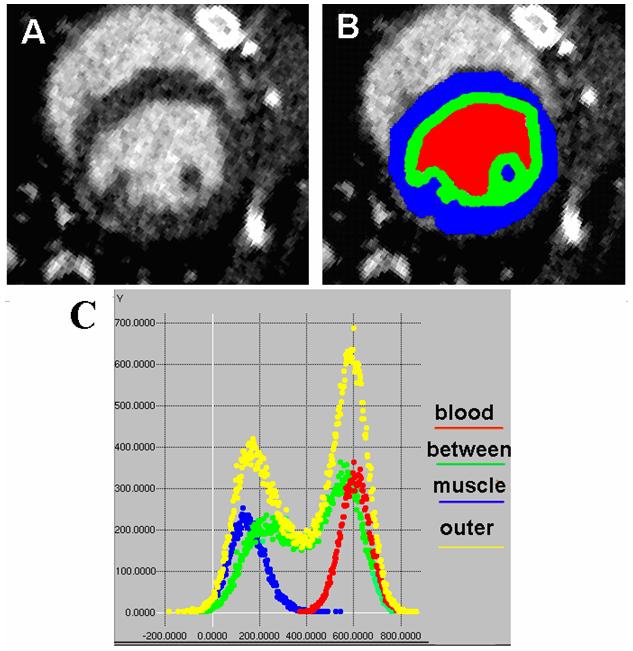
Fig. 3.

These axial images show micro-CT data (A) and a manual segmentation of the three relevant regions of an ROI slice (B). Red is selected as pure blood, blue as pure muscle and green as an intermediate unclassified transition zone spanning the blood/muscle boundary. The graph in (C) shows the corresponding color-coded histograms captured from the full 3D ROI of a dataset plus a yellow composite histogram of the entire ROI (which is therefore the sum of the blood, between, and muscle histograms).
