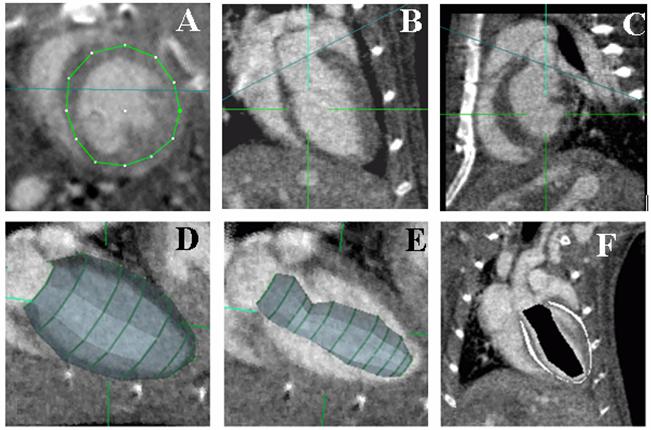
Fig 4.

A typical ROI basket is built by drawing outlines in short axis images (A). It is defined by only a few curves and its entire surface is inside the myocardium except at the valve plane. The valve plane, shown as the blue line in coronal (B) and sagittal (C) planes, is treated as a flat end to close the ROI volume enclosed by the basket (D). Image (E) shows a smaller ROI built to sample “pure” blood. Image (F) slices through the 3D regions produced by nesting the two ROIs that are used to measure mean values for “pure” blood and muscle, marked black and white respectively, as discussed in the text. Note: The Z axis as discussed for ROI shift tests is vertical in B, C and F.
