
Fig.7.
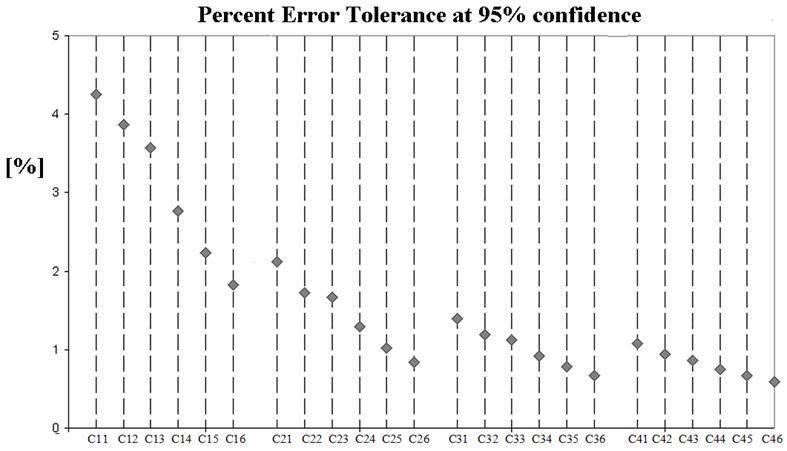
The error tolerance as percent of measured volume for a 95% confidence interval (i.e. 1.96σ) for the sampled region method. We are 95% confident that measured volumes are within ∼4% of the proper value over all but the lowest contrast set.
Official websites use .gov
A
.gov website belongs to an official
government organization in the United States.
Secure .gov websites use HTTPS
A lock (
) or https:// means you've safely
connected to the .gov website. Share sensitive
information only on official, secure websites.
The error tolerance as percent of measured volume for a 95% confidence interval (i.e. 1.96σ) for the sampled region method. We are 95% confident that measured volumes are within ∼4% of the proper value over all but the lowest contrast set.