Fig. 8.

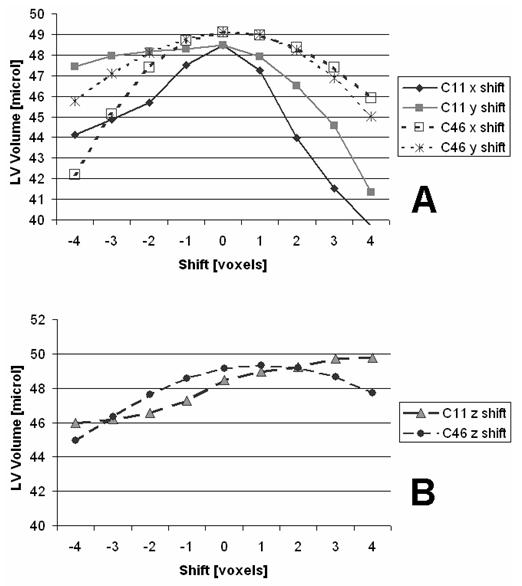
LV Volume variations using region sampling analysis for shifts of the ROI along X-Y axes (A) and Z-axis (B). We show here results for both the lowest (C11) and highest (C46) CNR quality data sets.

LV Volume variations using region sampling analysis for shifts of the ROI along X-Y axes (A) and Z-axis (B). We show here results for both the lowest (C11) and highest (C46) CNR quality data sets.