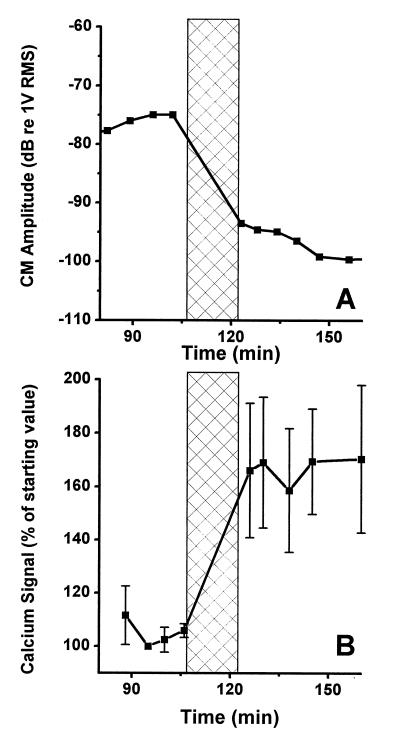
Figure 3.
(A) Recording of the CM amplitude before and after acoustic overstimulation. The overstimulation period is indicated by the crossed region. (B) Ca2+-dependent fluorescence in the same preparation as shown in A. Vertical bars centered on each point give the SE. The overstimulation resulted in a 60% increase of the fluorescence.

