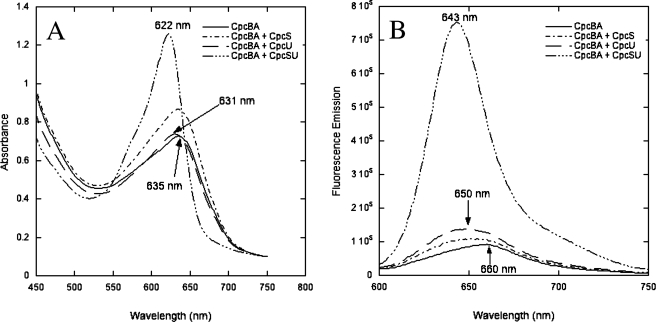
FIGURE 3.
Absorbance and fluorescence emission spectra of in vitro bilin addition reactions with CpcS-I and HT-CpcU and rCpcBA. A, absorbance spectra of reactions with rCpcBA alone (control, solid line) and rCpcBA with CpcS-I alone (dash dots), HT-CpcU alone (long dashes), or CpcS-I and HT-CpcU copurified (long dash triple dot). The absorption maxima of some reaction products are indicated. B, fluorescence emission spectra of the same reactions with excitation at 590 nm (10-nm slit widths). The fluorescence emission maximum for rCpcBA with CpcS-I/HT-CpcU was at 643 nm, whereas all products had emission maxima between 650 and 660 nm.

