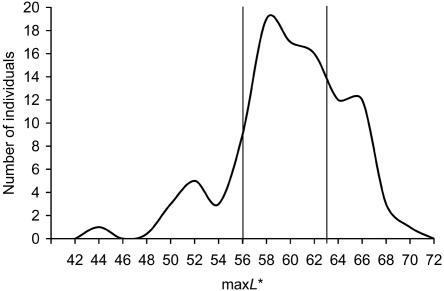
Figure 1. .
Histogram of maximum L* values (maxL*) in volunteers of South Asian ancestry. The maxL* values were obtained from 98 randomly selected individuals of South Asian ancestry living in the United Kingdom. The maxL* values for the 20th and 80th percentiles of the distribution are indicated by vertical lines.

