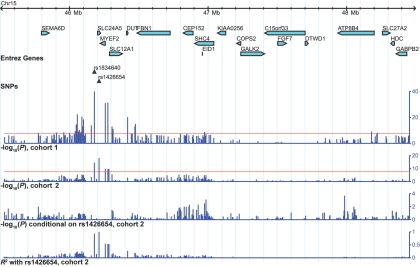
Figure 3. .
Association signals, linkage disequilibrium, and genes in the region 45,524,265–48,470,992 on chromosome 15q21. Negative log10 association P values (found by logistic regression and likelihood-ratio tests) are displayed for cohorts 1 and 2 and for an analysis conditioned on rs1426654 in cohort 2. The R2 value between each SNP genotyped in the region and the primary associated SNP rs1426654 is also displayed. The SNPs rs1834640 and rs1426654 show the strongest associations in cohort 1 and cohort 2, respectively. Red horizontal lines are drawn at the Bonferroni-corrected significance threshold for the genomewide scan (α=0.05/1,502,205=3.3×10-8) for cohort 1 and 2 associations. In the association analysis conditional on rs1426654, no SNPs met a significance level that would correct for the number of SNPs in the region (α=0.05/407=1.23×10-4). This figure was made using the Generic Genome Browser.47 Chr = chromosome.

