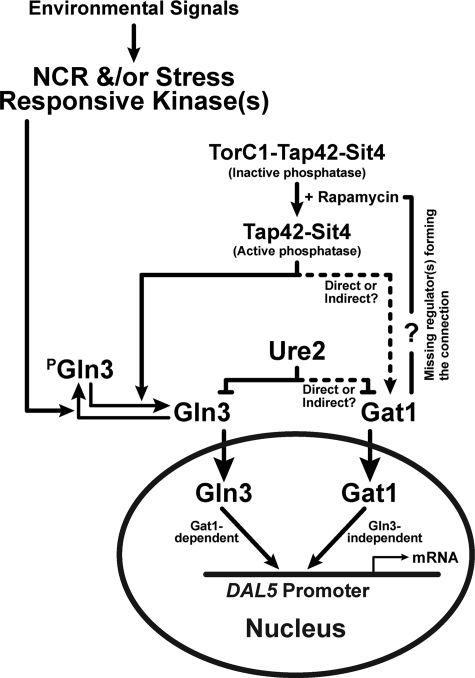
FIGURE 8.
Diagrammatic summary of data, showing bifurcation of Tor pathway at the level of GATA factor regulation. The arrows and bars indicate positive and negative regulation, respectively. The absence of arrows or bars indicates insufficient data are available to make such a characterization. This diagrammatic summary does not address the molecular mechanism of Gln3 regulation by Ure2 (two models have been suggested (8, 11)) or the transfer of environmental signals to Tor1,2 and other protein kinases.

