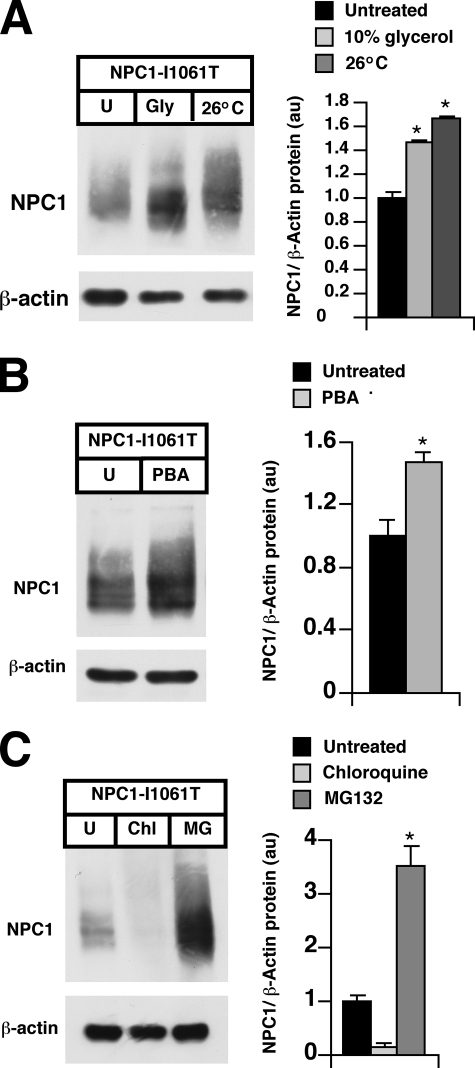
FIGURE 5.
NPC1I1061T protein is proteasomally degraded. A, NPC1I1061T cells were treated for 24 h in 10% glycerol or incubated at 26 °C, and cell lysates were subjected to Western blot analysis for NPC1 expression. A representative blot is shown and the graph displays NPC1 expression normalized toβ-actin. *, p < 0.05 for 26 °C versus untreated, p = 0.057 for glycerol versus untreated. B, NPC1I1061T cells were treated for 24 h with 20μm PBA, and lysates were subjected to Western blot analysis for NPC1 expression. A representative blot is shown and the graph displays NPC1 expression normalized to β-actin. *, p < 0.05 for PBA versus untreated. C, NPC1I1061T cells were treated for 24 h with the proteasome inhibitor MG132 (50 μm) or with the lysosome inhibitor chloroquine (10 μm), and lysates were subjected to Western blot analysis for NPC1 expression. A representative blot is shown and the graph displays NPC1 expression normalized to β-actin. *, p < 0.05 for MG132 versus untreated.

