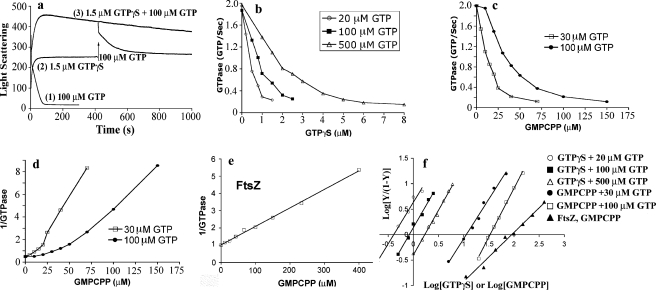
FIGURE 3.
Light scattering and GTPase activity of TubZ-Ba measured in the presence of non-hydrolyzable GTP analogues, GTPγS or GMPCPP. a, assembly measured by light scattering of 5 μm TubZ-Ba in 100 μm GTP; in 1.5 μm GTPγS, with 100 μm GTP added at 400 s; and in 1.5 μm GTPγS plus 100 μm GTP added together at time 0. b, inhibition of GTPase activity of TubZ-Ba by GTPγS. Data are shown for 5 μm TubZ-Ba and increasing GTPγS, plus 20, 100, and 500 μm GTP. c, inhibition of GTPase activity by GMPCPP. d, plot of 1/GTPase activity versus GMPCPP concentration, showing that the relationship is not linear. The curvature indicates that the inhibition is cooperative. e, plot of 1/GTPase activity versus GMPCPP concentration for 5 μm FtsZ and 100 μm GTP. In contrast to TubZ, this plot is linear. f, Hill plot of the GTPase inhibition by GTPγS and GMPCPP. The five lines on the left are for TubZ-Ba, with Hill coefficients of 1.7–1.9, and the line on the right is for FtsZ, with a Hill coefficient of 1.

