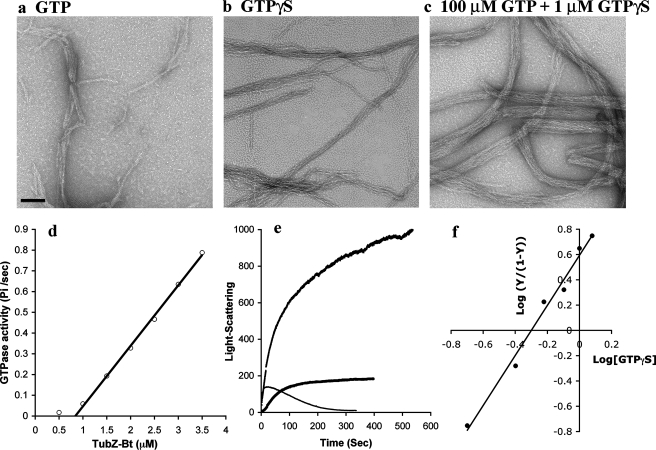
FIGURE 6.
Biochemical properties of TubZ-Bt. a–c, images of negatively stained polymers assembled in 1 mm GTP (a), 1 μm GTPγS(b), and a mixture of 100 μm GTP and 1 μm GTPγS(c). The bar is 100 nm. d, GTPase activity of TubZ-Bt showed a critical concentration of 0.8 μm, and above this a linear activity of 18 GTP TubZ-Bt–1 min–1. e, assembly of 3 μm TubZ-Bt with different combinations of nucleotides. In 0.1 mm GTP, rapid assembly was followed by disassembly. In 1 μm GTPγS assembly occurred more slowly and after 100 s remained at the plateau. In 100 μm GTP plus 1 μm GTPγS assembly rose much higher, and then continued a slower rise after 100 s. This second phase is probably due to bundling seen in c. f, Hill plot for inhibition of GTPase by GTPγS gives a Hill coefficient of 1.9.

