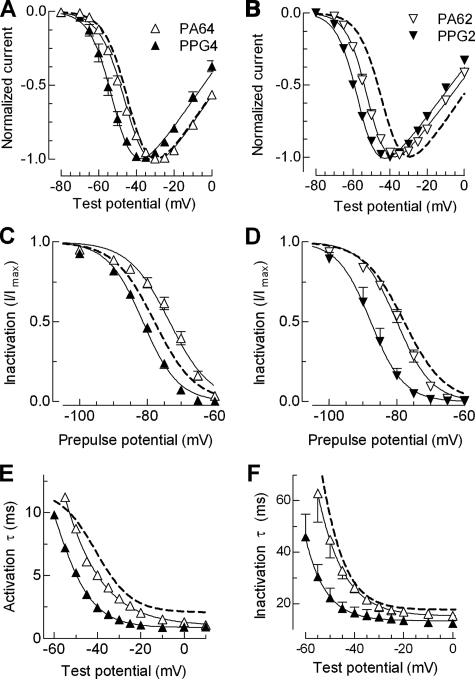
FIGURE 5.
Biophysical properties of mutants to probe the helical structure of putative helices 1 and 2. A and B, normalized I-V curves for PA and PPG mutations made in helix 1 (A) and helix 2 (B). Labeling of symbols in these panels applies to the entire figure. C and D, effect of these mutations on steady state inactivation. The data points were obtained by plotting the normalized peak Ca2+ current at –20 mV against the prepulse potential for the indicated mutants. The smooth curves represent Boltzmann fits to the average data. The results from the average of individual fits to each cell are reported in Table 1. E and F, voltage dependence of the time constants of activation (E) and inactivation kinetics (F) of the helix 1 mutants PA64 and PPG4. Time constants were obtained from two exponential fits of the raw traces and plotted against membrane potential. WT channel properties are represented with a dotted line.

