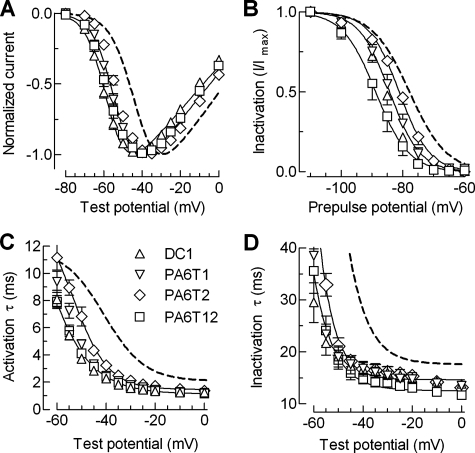
FIGURE 7.
Biophysical properties of the mutations made to disrupt the putative loop of the brake region. A, normalized IV plots for the DC1, PA6T1, PA6T2, and PA6T12 mutants. B, effects of these mutations on steady state inactivation. The data points were obtained by plotting the normalized peak Ca2+ current at –20 mV against the prepulse potential for the indicated mutants. The smooth curves represent Boltzmann fits to the average data. The results from the average of individual fits to each cell are reported in Table 1. C and D, voltage dependence of the time constants of activation (C) and inactivation (D) kinetics. Time constants were obtained from two exponential fits of the raw traces and plotted against membrane potential.

