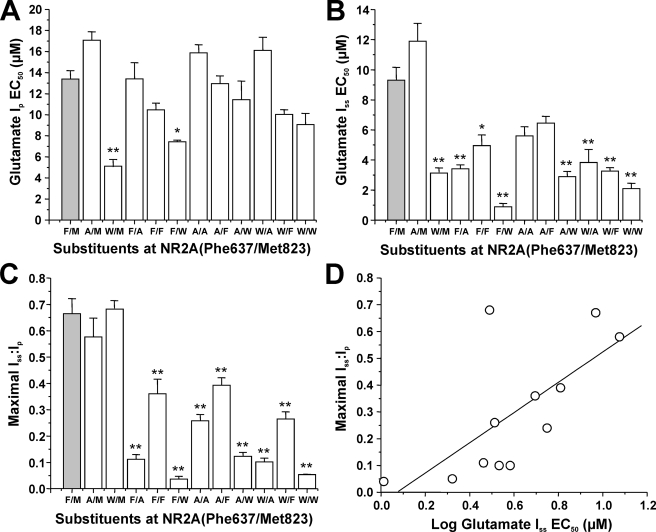
FIGURE 2.
Mutations at NR2A(Phe-637/823) can alter glutamate potency and desensitization. A and B, average EC50 values for glutamate activation of peak (A) and steady-state (B) current in lifted cells expressing NR1 and wild type NR2A subunits (F/M) or NR2A subunits containing various mutations at Phe-637 and Met-823. *, EC50 values that are significantly different from that for wild type NR1/NR2A subunits (*, p < 0.05; **, p < 0.01; ANOVA followed by Dunnett's test). Results are means ± S.E. of 5–8 cells. C, average values of maximal steady-state to peak current ratio (Iss/Ip) in lifted cells coexpressing NR1 and wild type NR2A subunits (F/M) or NR2A subunits containing various mutations at Phe-637 and Met-823. Currents were activated by 300 μm glutamate in the presence of 50 μm glycine and 10 μm EDTA. *, values that differed significantly from that for wild type NR1a/NR2A subunits (**, p < 0.01; ANOVA followed by Dunnett's test). Results are means ± S.E. of 5–8 cells. D, graph plots values of maximal Iss/Ip versus glutamate log EC50 for steady-state current in the series of mutants. Maximal Iss/Ip was significantly correlated with glutamate log EC50 for steady-state (R2 = 0.349, p < 0.05) but not peak (R2 = 0.0515, p > 0.05; results not shown) current. The line shown is the least-squares fit to the data. Values for wild type, NR2A(F637A), and NR2A(F637W) are from Ref. 24.

