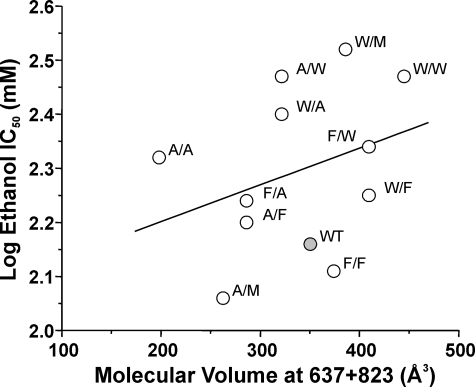
FIGURE 6.
Combined molecular volume at 637 and 823 in the NR2A subunit is not related to ethanol sensitivity. The graph plots ethanol IC50 versus the sum of the molecular volumes (in Å3) of the substituents at positions 637 and 823 for the series of mutants at NR2A(Phe-637/Met-823). There was not a significant linear relation between ethanol sensitivity and molecular volume at the two sites (R2 = 0.0229, p > 0.05).

