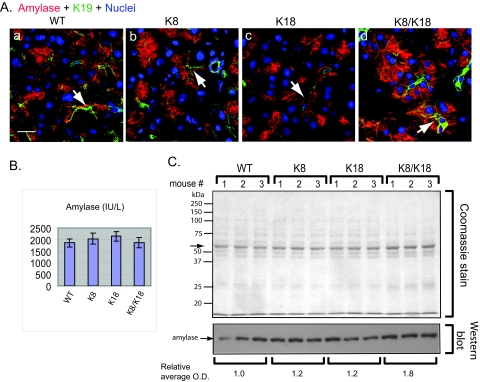
Figure 8.
Comparison of pancreatic amylase distribution and levels in control and keratin-overexpressor mice. A: Pancreata from WT (a), K8 (b), K18 (c), and K8/K18 (d) mice were analyzed by triple-immunofluorescence staining using Abs to amylase (red), K19 (green), and nuclear staining (blue). Arrows point to examples of lumens. B: Serum amylase ± SD of 10-week-old mice (n = 3/genotype). C: Total pancreatic lysates from WT, K8, K18, and K8/K18 mice were analyzed by SDS-PAGE then Coomassie staining (equal amount of protein was loaded per lane, arrow highlights the most abundant protein band that likely represents amylase primarily). Duplicate pancreatic lysates were also analyzed by immunoblotting using anti-amylase Ab followed by densitometric scanning of the amylase band (mean o.d. is shown). Scale bar = 20 μm.

