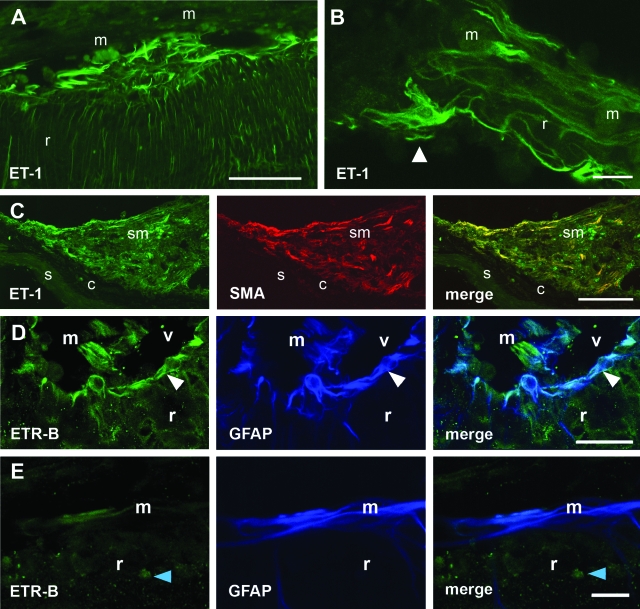
Figure 2.
ET-1 and ETR-B immunofluorescence in epi- and subretinal outgrowths appearing 2 weeks after 0.2 U/μl dispase intravitreal injection. A: Strong ET-1 immunofluorescence appeared in a region of disrupted ILM, where the vitreal surface was attached to an epiretinal membrane (m). Notice the thick endothelinergic processes parallel to the surface and the large number of thinner processes within the retina. B: In a membrane attached to the vitreal surface, an ET-1-immunoreactive cell could be identified as an astrocyte by its shape and planar distribution of cell processes. Numerous endothelinergic processes appeared within the membrane. r, retina. C: Confocal images of a subretinal membrane (sm) attached to the choroid (c). Numerous cells exhibiting ET-1 (green) and SMA (red) immunofluorescence can be observed. Merging demonstrates co-localization of both markers in elongate cells probably corresponding to myofibroblasts. s, sclera. D: Confocal images through the inner retina (r) showed ETR-B-immunoreactive cell bodies and processes placed along the vitreal surface (white arrowhead). GFAP antiserum labeled the same structures. Some radial processes were labeled by only one of these markers. An epiretinal membrane (m) appearing within the vitreal (v) space showed almost complete segregation of ETR-B and GFAP immunofluorescence. E: Confocal images through an epiretinal membrane attached to the retinal surface showed a few ETR-B-immunoreactive cells. GFAP labeled a larger group of elongate cells. The merged image demonstrated that these ETR-B-immunoreactive cells also had GFAP immunoreactivity, whereas most GFAP-immunoreactive cells lacked ETR-B immunofluorescence. The blue arrowhead points to an ETR-B-immunoreactive cell nucleus. Scale bars: 50 μm (A, B); 100 μm (C); 25 μm (D, E).

