
Figure 7.
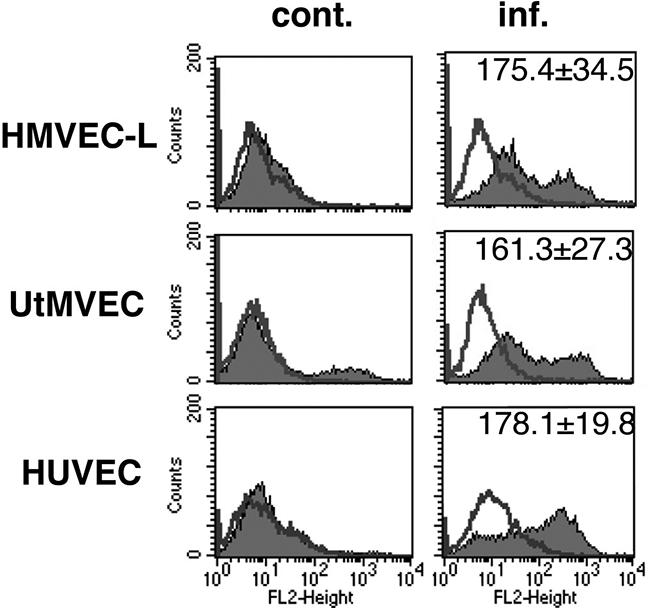
Different CMV-infected endothelial cell types induce different levels of integrin αvβ6. Flow cytometric analysis of integrin αvβ6 in HMVEC-L, UtMVECs, and HUVECs at 10 days after infection with VR1814. Typical histograms from control (cont.) and infected (inf.) cells are shown. Shaded areas represent expression of specific proteins. Lines represent isotype control. Numbers represent mean fluorescence intensity (mean ± SE). The experiments were repeated at least three times.