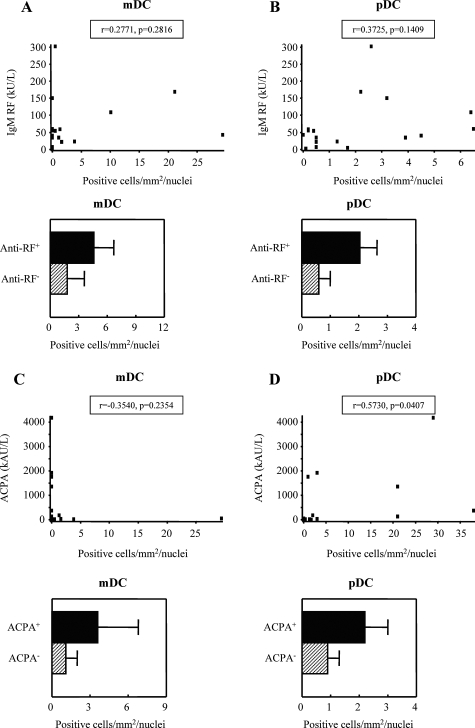
Figure 2.
Correlation between mDC and pDC numbers in RA ST to RF (A and B, n = 17) and ACPA serum levels (C and D, n = 13). ST mDC and pDC numbers in RF+/− (positive, n = 16; negative, n = 4) and ACPA+/− (positive, n = 9; negative, n = 4) patients. Data expressed as positive cells/mm2/total nuclei (values are corrected for the global cell infiltration of the synovium, eg, number of nuclei). Spearman rank correlation was used where a P value <0.05 was considered as the level of significance.

