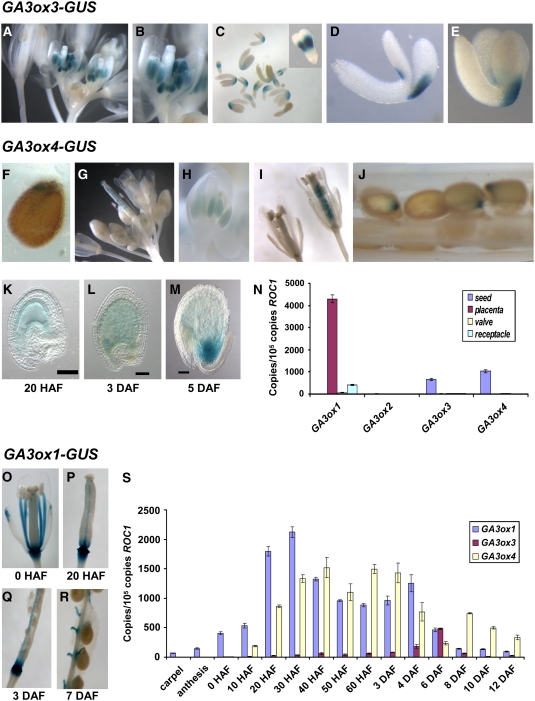
Figure 4.
Temporal and Spatial Expression of GA3ox Genes.
(A) to (E) GA3ox3-GUS line.
(A) Flower cluster.
(B) Close-up of single flower.
(C) Developing embryos between torpedo and upturned-U stages. Inset: close-up of torpedo stage embryo.
(D) Close-up of walking stick stage embryo.
(E) Close-up of upturned-U stage embryo.
(F) to (M) GA3ox4-GUS line.
(F) Seed, 6 h after imbibition.
(G) Flower cluster.
(H) Close-up of a young flower.
(I) Close-up of flowers with young siliques. Silique age: 0 HAF (left) and 20 HAF (right).
(J) Developing seeds in a silique at 7 DAF.
(K) to (M) Clearing of developing GA3ox4-GUS seeds by Hoyer's medium. Bars = 50 μm.
(N) Expression of GA3ox genes in 6- to 8-DAF wild-type siliques as gauged by qRT-PCR. Placenta contains septum, replums, and funiculi.
(O) to (R) GA3ox1-GUS expression in carpel and developing siliques.
(S) Temporal expression of GA3ox1, GA3ox3, and GA3ox4 during silique growth. The levels of gene expression in (N) and (S) are represented by the copies of cDNA per 105 copies of ROC1. Means ± se of three technical replicates are shown in both (N) and (S). Each experiment was repeated once using independent samples with similar results. Silique stages were defined according to Bowman (1994) (see Supplemental Table 1 online).

