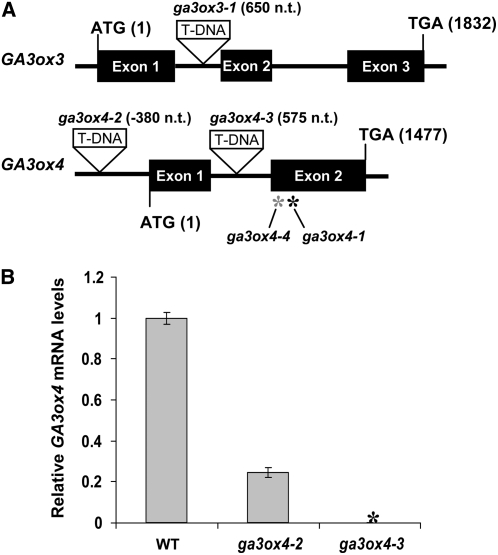
Figure 6.
The ga3ox3 and ga3ox4 Mutant Lines.
(A) Locations of mutations in the ga3ox3 and ga3ox4 mutants. T-DNA insertion sites are depicted as triangles. Numbers next to T-DNA insertions indicate the insertion sites relative to ATG. The black and gray asterisks indicate the positions of ga3ox4-1 and ga3ox4-4 missense mutations at 1094 and 1046 nucleotides after ATG, respectively.
(B) Relative GA3ox4 transcript levels in siliques of ga3ox4-2 and ga3ox4-3 compared with the wild type. The means of three technical replicates of qRT-PCR ± se are shown. The expression level in the wild type was set to 1.0. Black asterisk indicates no wild-type GA3ox4 transcript was detected in ga3ox4-3. Similar results were obtained when qRT-PCR was performed using a second set of samples.

