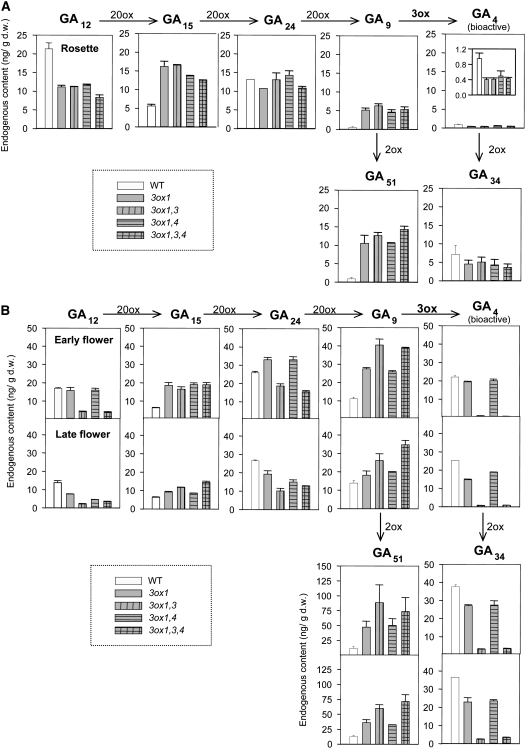
Figure 8.
Endogenous GA levels in Rosette Leaves and Flowers of Wild-Type and Category II ga3ox Mutant Plants.
(A) GA levels (nanograms per gram dry weight [ng/g d.w.]) in rosette leaves at anthesis of the first flower. The data for GA4 are also shown in the inset with a different y axis scale for clarity. Data are means ± se of biological duplicates.
(B) GA levels in early (top graph) and late (bottom graphs) flowers. Note that the y axis scale for GA51 is different from that for other GAs. Means ± se of biological triplicates are shown. Results of 13-OH GAs are shown in Supplemental Figure 7 online.

