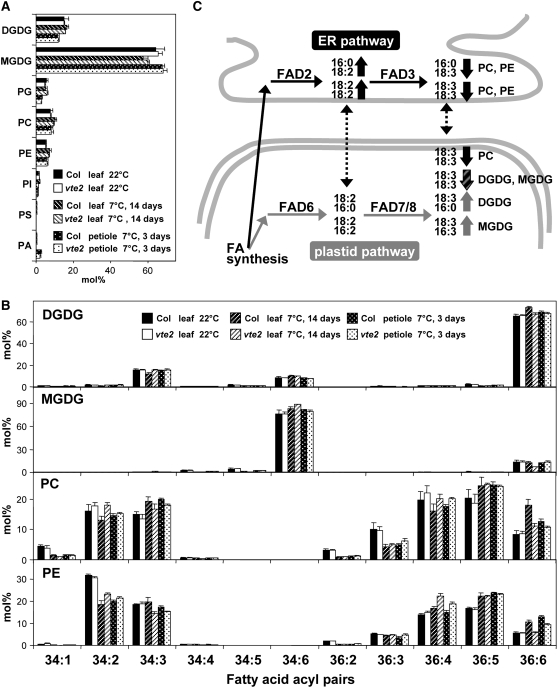
Figure 3.
Lipid Profiles of Col and vte2 Leaves and Petioles before and after 14 d of LT Treatment.
(A) and (B) Col and vte2 were grown at 22°C for 4 weeks and then transferred to 7°C. Black and white bars are Col and vte2 leaves, respectively, before LT treatment. White-hatched and black-hatched bars are Col and vte2 leaves, respectively, after 14 d of LT treatment. White-dotted and black-dotted bars are Col and vte2 petioles, respectively, after 3 d of LT treatment. Values are means ± sd (n = 5 biological replicates) and are expressed as mol %. PI, phosphatidylinositol; PS, phosphatidylserine; PA, phosphatidic acid; FA, fatty acid.
(A) Mole percent of total polar lipid classes analyzed.
(B) Mole percent of fatty acids esterified to DGDG, MGDG, PC, and PE.
(C) A diagram summarizing membrane PUFA biosynthesis in Arabidopsis and the PUFA-containing lipid molecular species (e.g., PC and PE with 16:0 and 18:3 acyls shown at the right top corner) that are higher (up arrows) and lower (down arrows) in LT-treated vte2 relative to Col. Black and gray arrows indicate acyl pairs derived from the ER and plastid pathways, respectively, while the striped arrow indicates lipid species that can be produced from both pathways. Dotted arrows illustrate proposed transfer of lipids between the ER and plastid.

