Figure 7.
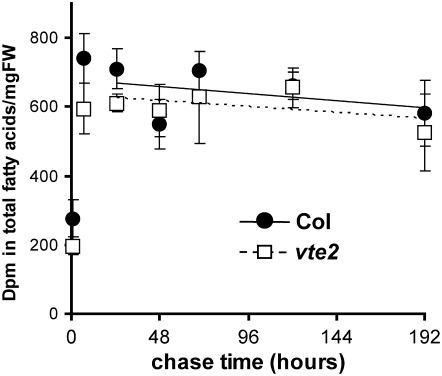
14CO2 Pulse Chase Labeling of Total Fatty Acids in LT-Treated Col and vte2.
Col (closed circles) and vte2 (open squares) grown at 22°C for 3 weeks were transferred to 7°C for 3 d and then pulse labeled with 14CO2 for 30 min and chased in air at 7°C. At the indicated times, leaf samples were harvested and the specific activity in total fatty acids determined. Samples for the initial time point were taken immediately after labeling (30 min). Values are means ± sd (n = 3 biological replicates) and are expressed as radioactivity detected in total fatty acids per mg fresh weight (FW). Estimated rates of fatty acid turnover are indicated as the slopes of solid (Col) and dotted (vte2) lines based on values starting at the 24-h time point.

