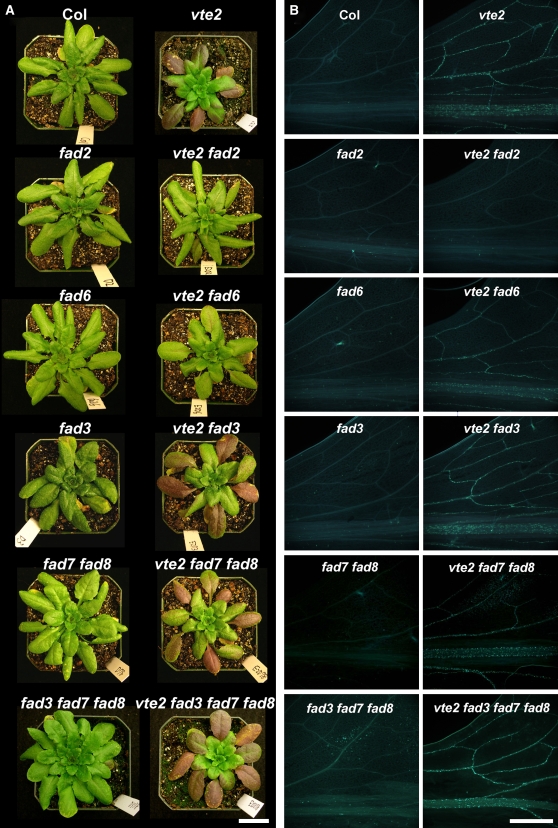
Figure 8.
Visible Phenotype and Callose Deposition of LT-Treated Col, vte2, and a Series of fad and vte2-Containing fad Mutants.
All genotypes were grown at 22°C for 4 weeks and then transferred to 7°C.
(A) Representative plants of the indicated genotypes after 4 weeks of LT treatment. Bar = 2 cm.
(B) Aniline blue–positive fluorescence in the lower half of the leaves after 3 d of LT treatment. Bar = 1 mm.

