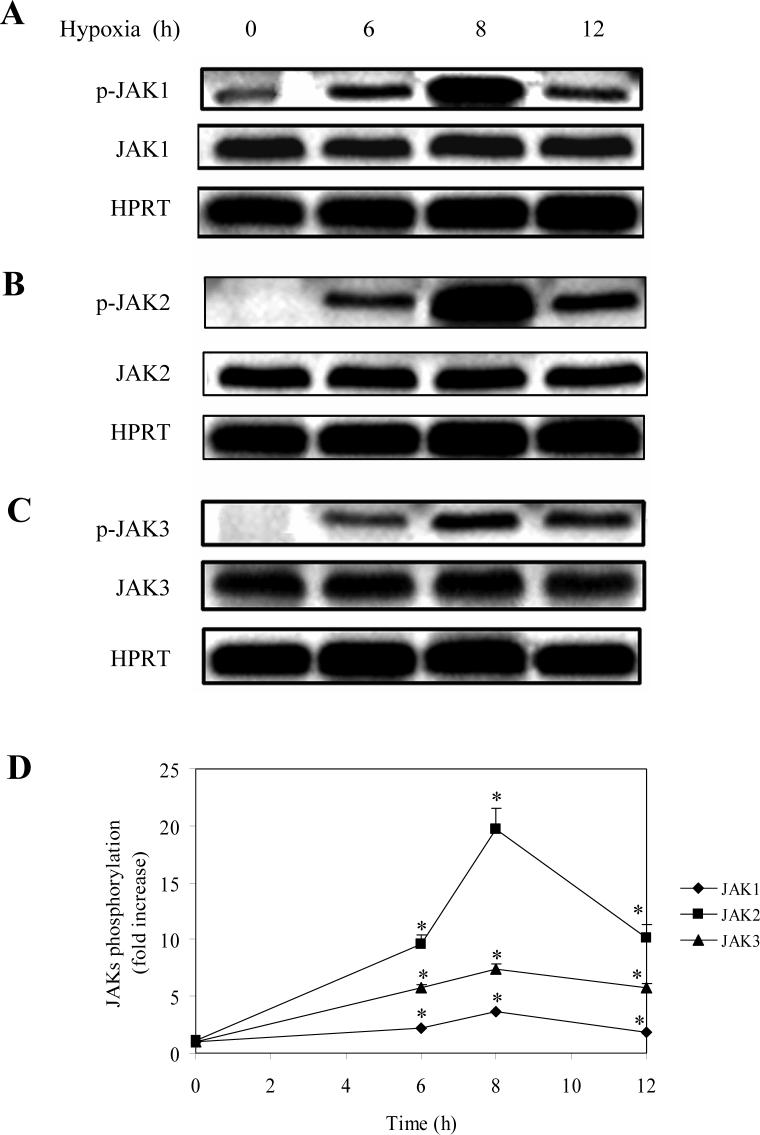
Fig. 2.
Effect of hypoxia on the phosphorylation of JAK1, JAK2 and JAK3. LMVEC were subjected to hypoxia for 6, 8 and 10 h. A, B and C. Representative gels showing phosphorylation/activation of JAK1 (A), JAK2 (B) and JAK3 (C). Upper panel – phsophorylated JAKs; middle panel – total JAKs; lower panel – expression of HPRT as loading controls. B. Quantitative data of JAK phosphorylation normalized to the total JAK expression. The data shown are fold increase and are presented as the means ± SE of three individual experiments. * P<0.05 versus their respective normoxic controls (time 0).

