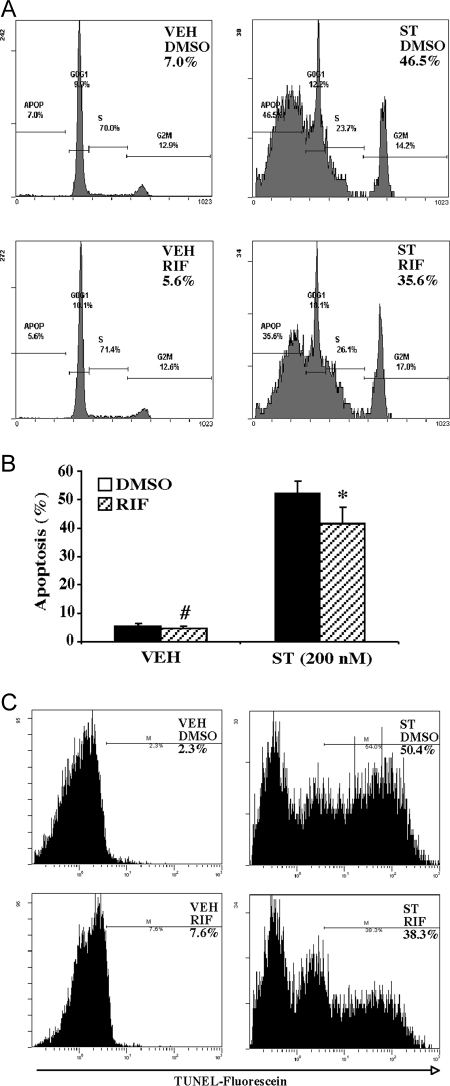
Figure 4.
Pharmacological Activation of Endogenous PXR in LS180 Cells Inhibited Staurosporine-Induced Apoptosis
A and B, Flow cytometry analysis with the percentages of apoptotic sub-G1 cell populations labeled (A) and quantification of sub-G1 cells (B) in staurosporine (200 nm)-treated parent LS180 cells in the presence or absence of RIF (10 μm). Results shown in panel B represent averages and sd from three independent experiments. C, Apoptosis measured by TUNEL assay followed by flow cytometry. The percentages of TUNEL-positive cells are labeled. ST, Staurosporine; VEH, vehicle. *, P < 0.05; #, P > 0.05, compared with their respective dimethylsulfoxide (DMSO) control groups.

