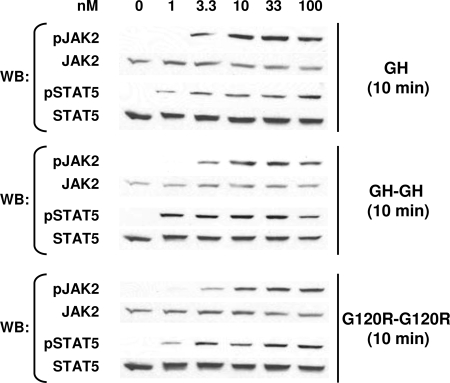
Figure 7.
Dose-Response Profiles for Signaling in 3T3-F442A Cells in Response to Monomeric and Dimeric Ligands
Serum-starved 3T3-F442A cells were treated with the indicated concentrations of GH, GH-GH, or G120R-G120R for 10 min before extraction, resolution of equal amounts of proteins per sample by SDS-PAGE, Western transfer, and sequential immunoblotting with the indicated antibodies. In each experiment, samples resulting from stimulation with each ligand were evaluated on separate gels, and immunoblotting was optimized for each so as to provide comparable exposures for each stimulus and allow comparison of dose-response profiles rather than comparison of relative signal intensities. The experiments shown are representative of three such experiments. WB, Western blot.

