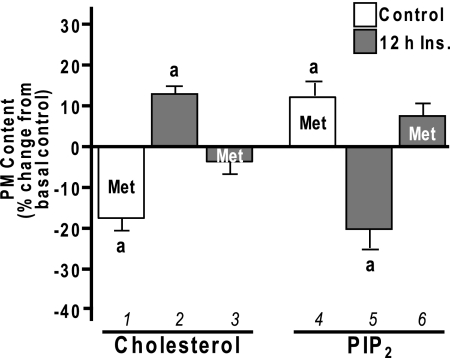
Figure 10.
Metformin-Induced Changes in PM Cholesterol and PIP2
3T3-L1 adipocytes were pretreated without (white bars) or with (gray bars) 5 nm insulin for 12 h in the absence or presence of metformin (Met), which was added to the culturing medium 4 h before the 12-h insulin pretreatment for a total time of 16 h. PM fractions and sheets were prepared, and the contents of cholesterol (left group) and PIP2 (right group) were determined, respectively. Values are means ± sem from three to four independent experiments. a, P < 0.05 vs. basal control.

