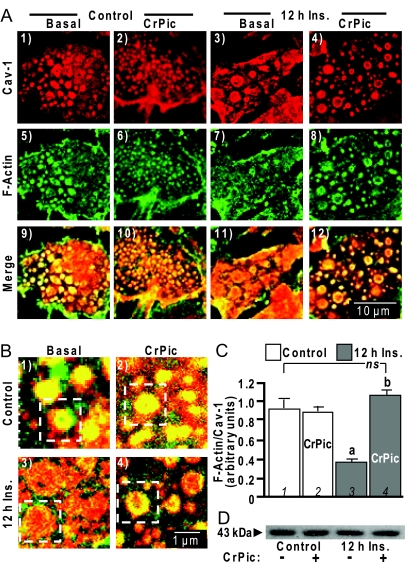
Figure 4.
Cholesterol-Laden PM Diminishes F-Actin in and/or near Caveolin-Containing PM
A, PM sheets were prepared from cells pretreated as described in Fig. 3 and were colabeled with an anti-caveolin-1 antibody (panels 1–4) and FITC-phalloidin (panels 5–8), and images showing the merged labels are shown in panels 9–12; B, zoomed images of the merged labels are shown in panels 1–4; C, relative labeling of F-actin/Cav-1 was determined by digitally quantifying immunofluorescent label intensities as described in Fig. 3; D, Western blot of total cellular actin in the four treatment groups. All microscope and camera settings were identical between groups, and shown images are representative from over 30 images collected from three to five independent experiments. a, P < 0.05 vs. control (bar 1); b, P < 0.05 vs. 12 h Ins.

