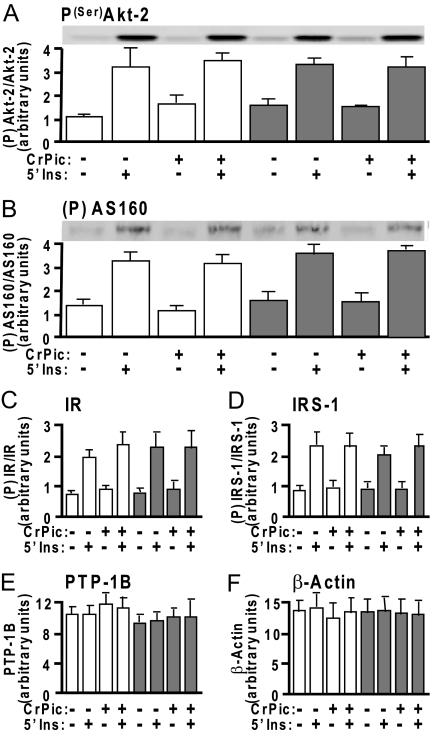
Figure 8.
Basal and Insulin-Stimulated IR Signal Propagation Is Unaffected by the Hyperinsulinemia and/or CrPic Treatments
Cells were treated as described in Fig. 1. After treatment, whole-cell lysates were prepared and subjected to Western blot analyses to assess Akt2(Ser474) phosphorylation (A), phospho-Akt substrate phosphorylation (B), IR phosphorylation (C), IRS-1 phosphorylation (D), total cellular PTP-1B (E), and β-Actin (F). White bars and gray bars represent control and hyperinsulinemic groups, respectively. Immunoblots shown in A and B are representative of three independent experiments, and all quantitated values presented as means ± sem from three independent experiments were determined by densitometry and normalized to either total protein (Akt2, AS160, IR, and IRS-1) or total cellular β-actin (PTP-1B). All insulin-stimulated values were significantly (P < 0.05) elevated over their respective controls.

