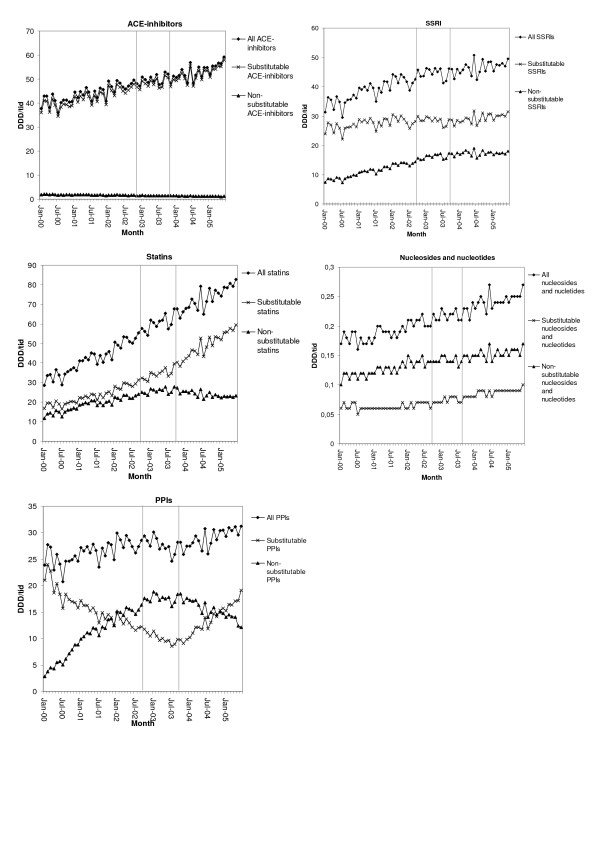
Figure 1.
Total sales volumes of non-substitutable and substitutable drugs in the included therapeutic groups. Volumes expressed as defined daily doses per 1000 inhabitants and day (DDD/1000 inhabitants and day). The two vertical reference lines indicate the implementation period for generic substitution (1 October 2002–30 September 2003).

