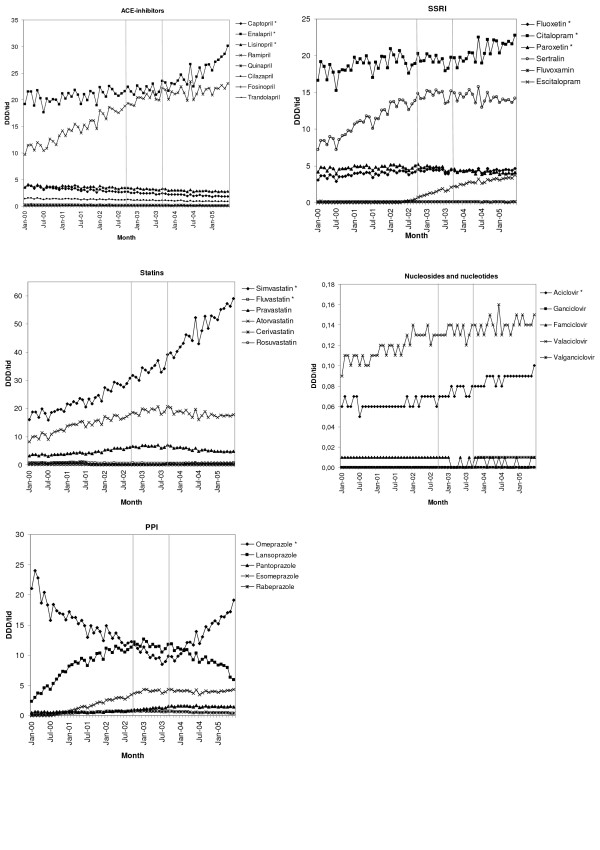
Figure 2.
Volumes sold of each substance in the included therapeutic groups. Volumes sold for each substance included in the selected therapeutic groups, expressed as defined daily doses per 1000 inhabitants and day (DDD/1000 inhabitants and day). The two vertical reference lines indicate the implementation period for generic substitution (1 October 2002–30 September 2003). An * after the substance name indicates a substitutable substance.

