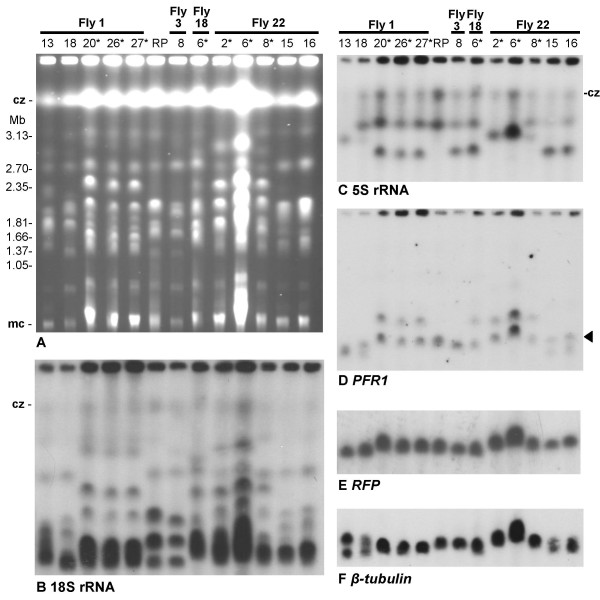
Figure 6.
Comparison of red parental and progeny clones by PFG electrophoresis. A. Ethidium bromide stained gel comparing the molecular karyotypes of red fluorescent clones, including red parent J10 (RP). The other lanes show the karyotypes of various hybrid progeny clones from 4 different flies. Size marker: chromosomal DNAs from Hansenula wingei. Cz = compression zone, a region of the gel where several large chromosomal bands are trapped. Mc = minichromosomes of approx. 100 kb in size. B – F. Autoradiographs showing results following hybridization with the probes indicated. All blots were washed to 0.1 × SSC at 65°C. The arrow (panel D) indicates the PFR1 chromosomal band that also hybridizes with the RFP probe (panel E). The asterisked clones had 4N DNA contents; all other clones were diploid like the parents except for Fly 1 clone 18, with DNA content 3N. These hybridization results give no hint that any of these clones, whatever its DNA content, has extra chromosome bands.

