
Figure 9.
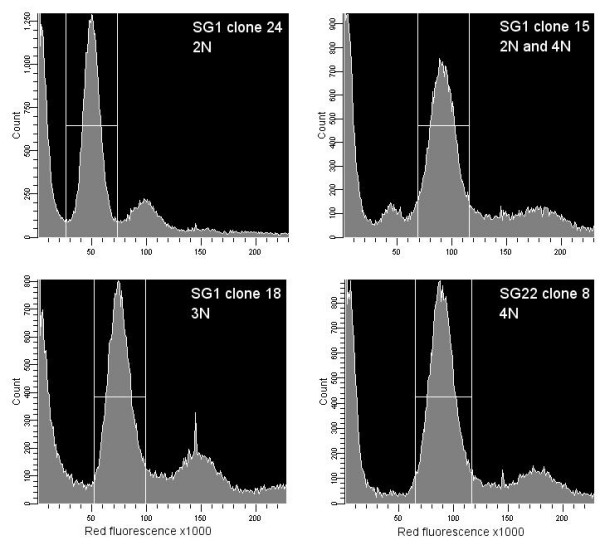
Flow cytometry histograms. Flow cytometry histograms for 4 hybrid trypanosome clones as indicated. Red fluorescence in arbitrary units (x axis) against cell count (y axis). The G1 peak for each histogram is gated; an additional smaller G1 peak is present in SG1 clone 15.